Posts

Showing posts with the label CHP

CHP Bullish Divergence pattern
Image
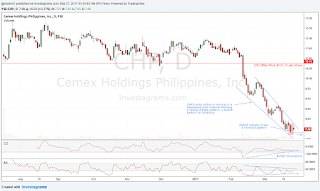
Cemex Holdings Philippines, Inc. CHP's recent price action is moving in a downward price channel and forming a Falling Wedge pattern, considered a bullish pattern on breakout. The Bullish Divergence pattern on some indicators also suggest an impending consolidation or trend reversal to potentially unfold. There's also a  Bullish Harami Cross candlestick pattern that formed up two trading days ago which is considered a significant bullish reversal pattern on confirmation. If another bullish candlestick pattern shows up to form a price congestion area, it will potentially mark the bottom of the current downtrend. Trading Plan - Buy the breakout from the Falling Wedge pattern (only consider this action on breakout confirmation). - If more bullish reversal candlestick pattern shows up in a sideways price action, consider a test buy for a position trade. - Always set a stop-loss in either of the trading setup to manage the downside risk (can be a few points from the recent swing...

CHP potentially bottomed out already

Image
Cemex Holdings Philippines, Inc. CHP has potentially bottomed out already after a clearer Bullish Divergence pattern on several indicators has been established. The recent sharp sell-off was halted after hitting its 200% retracement from its short term rebound (9.05 to 9.89). A further confirmation of a bottoming pattern is the Bullish Harami candlestick pattern with potential confirmation today. *Bullish Divergence pattern on indicators like CCI, RSI, EFI, MACD Histogram and a few others. *Immediate resistance is the previous support prior to 2nd breakdown at 9.05. *Immediate support around the 200% retracement. Previous analysis: https://psetrends.blogspot.com/2017/03/chp-potential-for-bullish-divergence.html Trading Plan - Test buy - Set the stop-loss just a bit below the recent low at 8.12 (or on breakdown from 8) - Immediate TP at 9.05. Profit run on strong momentum towards 10.75.

CHP potential for Bullish Divergence pattern

Image
Cemex Holdings Philippines, Inc. CHP has halted its 7th day sell-off after hitting its 200% retracement from its recent short term rebound (9.05 to 9.89). *Potential Bullish Divergence pattern may be developing from several indicators. *200% retracement may act as immediate support area. Trading Plan - Buy on reversal pattern after confirming a bullish divergence signal. - Set a tight stop-loss on any test buy trade.

CHP potentially bottomed out already

Image
Cemex Holdings Philippines, Inc. CHP has potentially bottomed out already at 9.05. A rebound from this level followed by a retest of this area will likely form a bullish Double Bottom pattern and will potentially be another buy opportunity if it also gives a bullish divergence pattern on some oscillators/indicators. *IPO price of CHP was at P10.75 per share, a possible resistance area. Trading Plan - Test buy near the recent bottom or wait for another pullback near the recent bottom. - Set stop-loss just below 9.05 (or below 9). - Potential TP is near the resistance area around 10.75.